Tech Divide: Mapping Global AI Production, Adoption, and Policy Alignment
Role: Co-Lead (with Lisa Thanh Thanh Lam) | Duration: Fall 2025 | Focus: Data Science, AI Governance, Development Economics
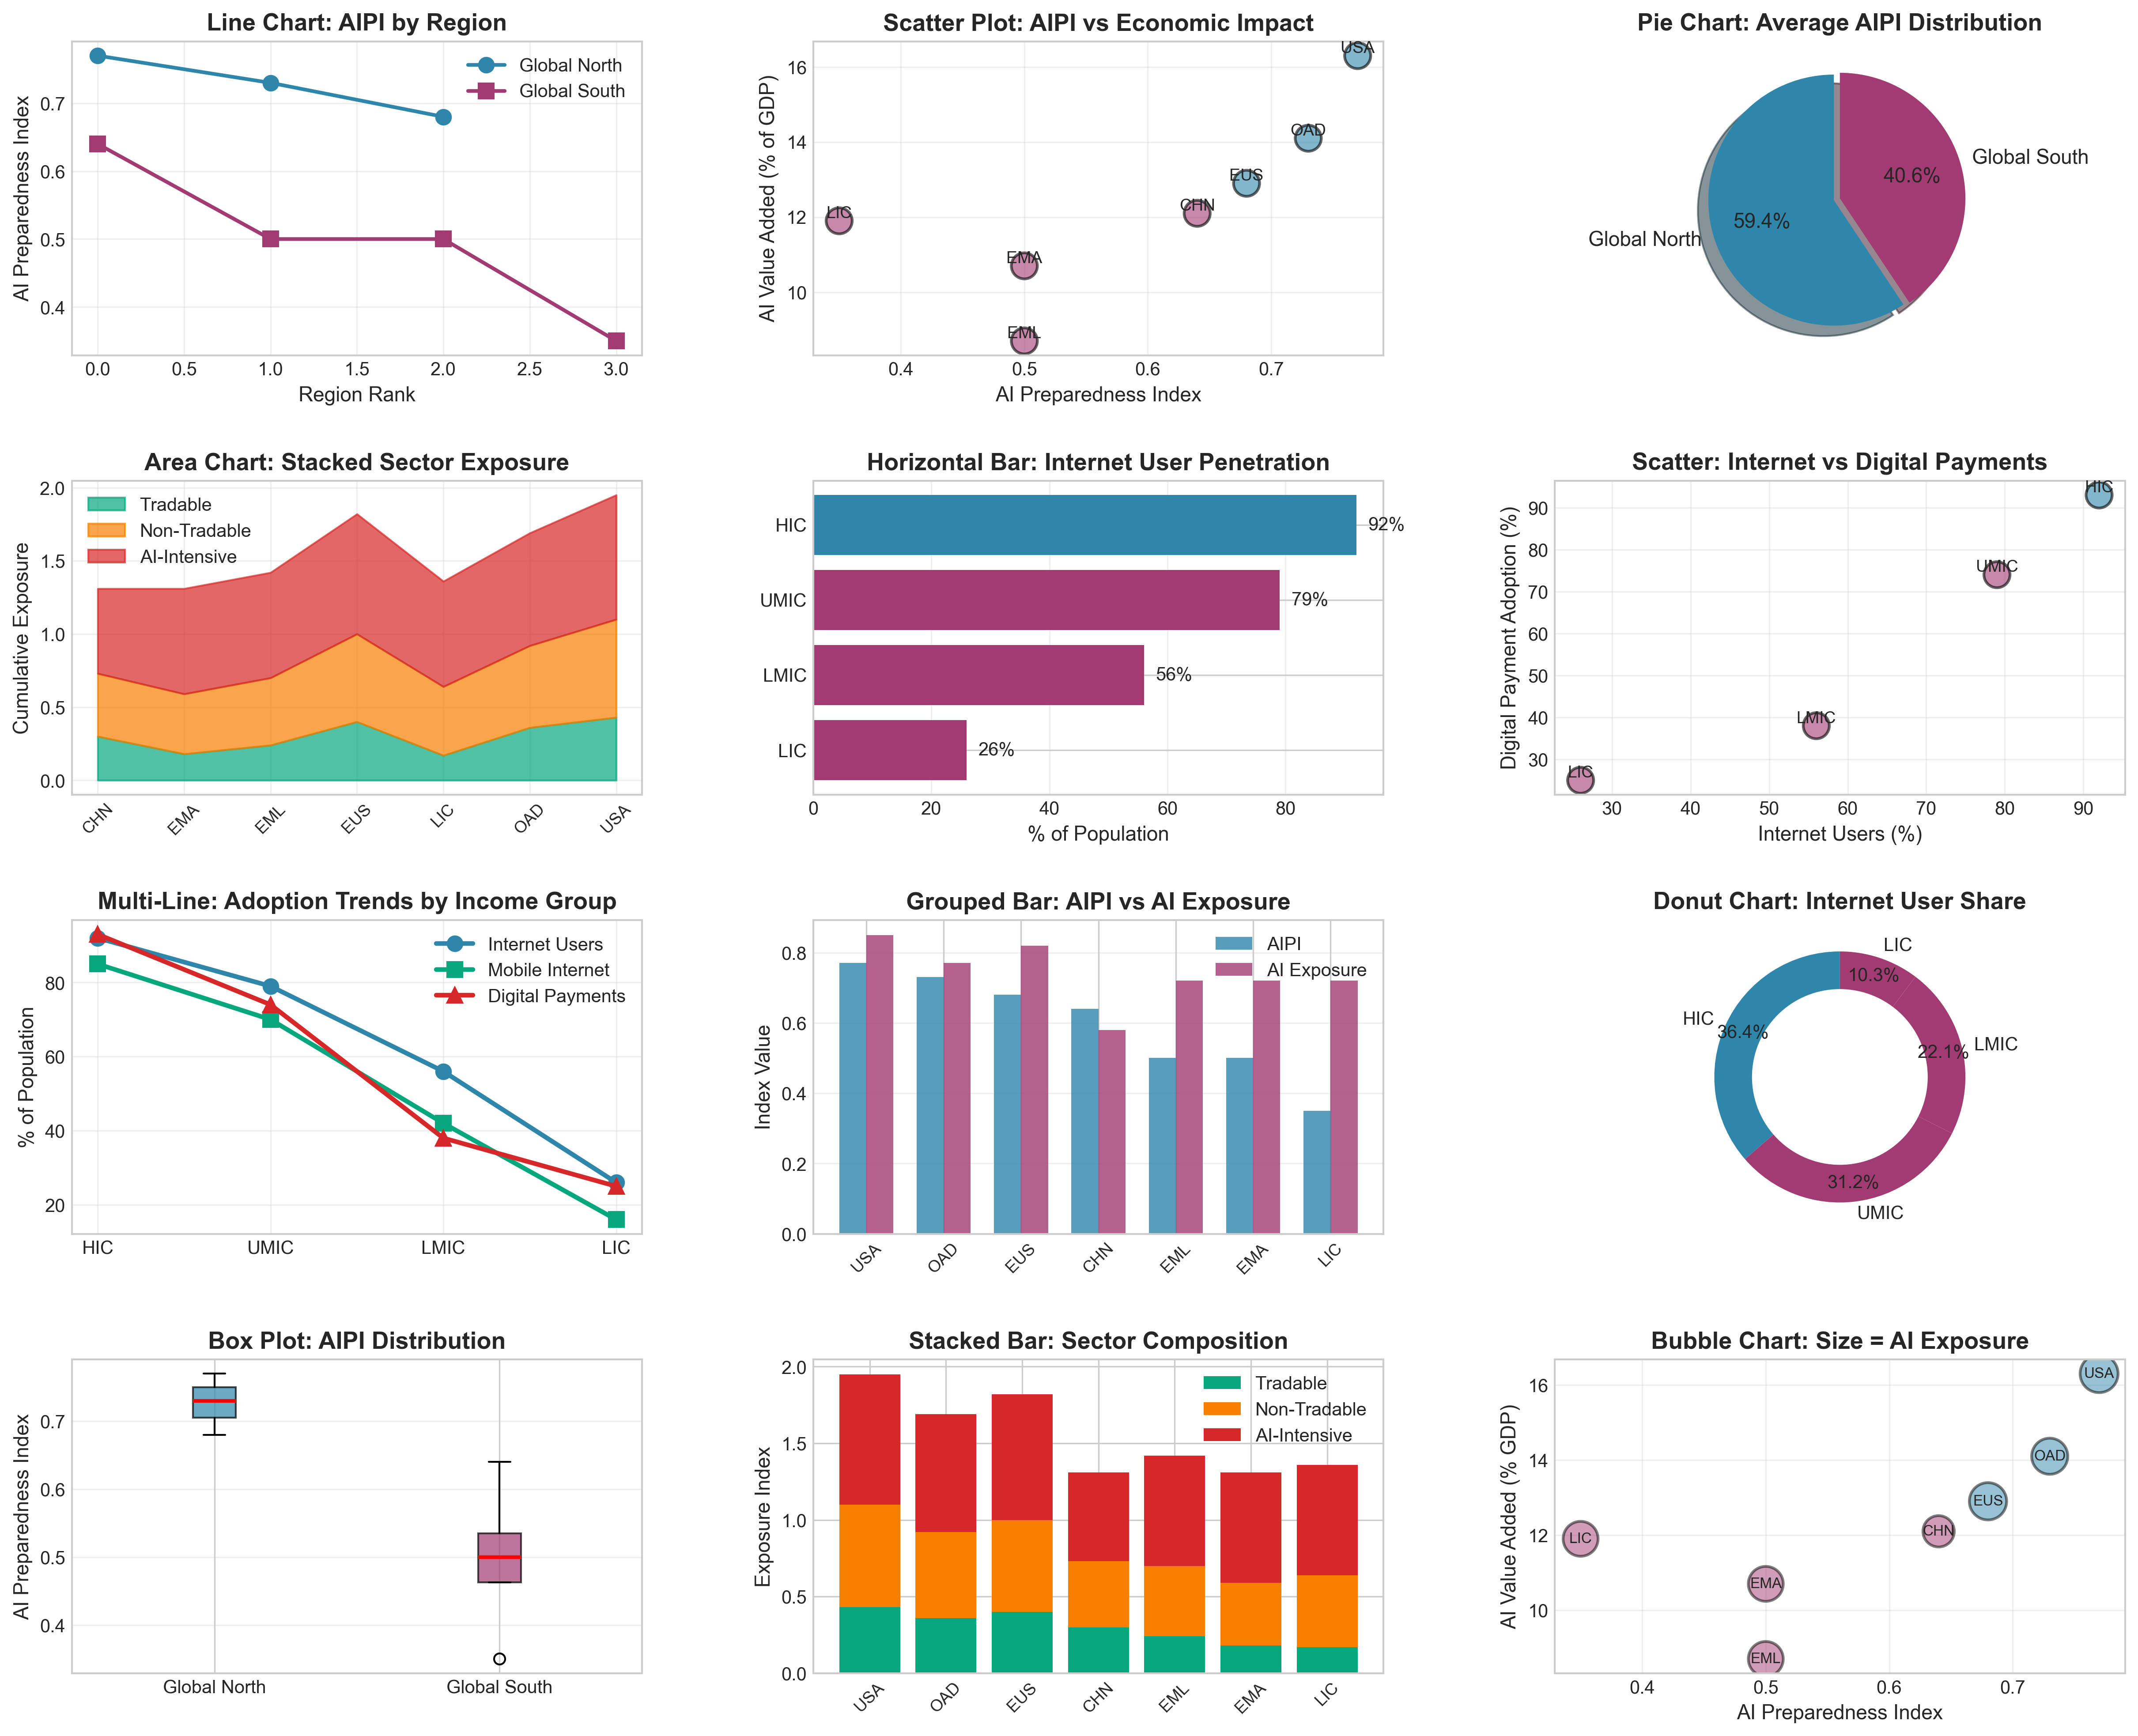
This quantitative analysis examined how disparities in AI production and adoption between Global North and Global South create a two-tier technological economy where policy readiness does not correlate with implementation capacity. Using data from the IMF (AI Preparedness Index covering 174 countries), World Bank (Digital Progress and Trends Report 2023), UN/ILO, and Oxford Insights (Government AI Readiness Index 2024), we conducted comprehensive statistical analysis across seven macro-regions representing all income levels.
The methodology employed multiple data science techniques: K-Means clustering (k=2, silhouette score=0.500) to identify natural groupings in technological capabilities; linear regression to compare adoption trajectory slopes across regions; and correlation analysis to quantify the production-policy relationship. We developed a Tech Production Index and Tech Adoption Index through feature engineering, then validated our central hypothesis using scatter plot analysis and regional aggregation. The analysis revealed a stark 46% preparedness gap (Tech Leaders AIPI=0.73 vs Emerging Economies AIPI=0.50) that translates to a 100% difference in projected economic gains (5.4% GDP growth for USA vs 2.7% for low-income countries).
Critical findings demonstrate policy-capacity misalignment: the Global North shows strong correlation (r=0.72) between tech production and policy development, indicating organic policy emergence from industry needs, while the Global South exhibits weak correlation (r=0.23), validating our hypothesis that developing countries import policies without corresponding local capacity. Linear regression analysis revealed paradoxical patterns - the Global South shows 51.8% faster internet user growth (slope=113.014 vs 74.431), suggesting technology leapfrogging, yet fixed broadband infrastructure grows 2.8x slower (slope=0.582 vs 1.652), indicating quality-of-connectivity disparities that raw access metrics obscure.
Infrastructure analysis quantified resource disparities: the US attracted $694 billion in venture capital (2008-2017) versus $24 billion for emerging markets excluding China/India; the US built 19x more cloud data centers than India; training GPT-4 cost $78 million, prohibitive for resource-constrained countries. These findings demonstrate that AI preparedness determines who benefits from AI - technology alone is insufficient without supporting infrastructure (digital connectivity, skilled workforce, innovation ecosystems, regulatory capacity).
The project produced 12 visualization types including choropleth world maps, scatter plots with correlation coefficients, time-series adoption trends, and comparative bar charts, all implemented using Python (Pandas for data manipulation, NumPy for numerical operations, Matplotlib for visualization, scikit-learn for clustering). All code and analysis are reproducible and documented.
Skills Demonstrated: Python (Pandas, NumPy, Matplotlib, scikit-learn), statistical analysis, K-Means clustering, linear regression, correlation analysis, data visualization, international development research, policy analysis, technical writing.
Details of the entire project and the final report can be found here:
Category: masters portfolio
346 
0

Comments